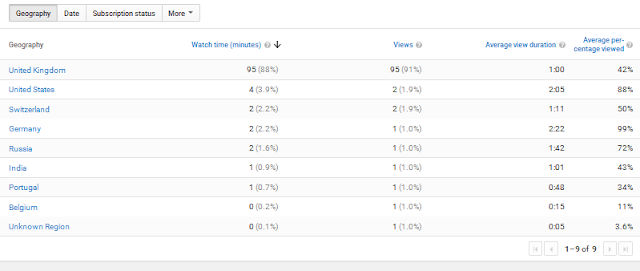
This next image allows me to see where the views have come from (location). The majority of views have been from the UK, which is something that did not come as a surprise to me at all as the production of the video was in english and was uploaded by the school onto the Hurtwood account, also the girls in our video were all from the UK.
This screenshot helps me see the 'average view duration', which is shown as 1:01, this means at this time the average viewer turns it off, this did not come as a surprise as you get moved onto this music video after seeing the previous one, which means people turn it off within the first couple seconds. Our video has been watched all the way through, which means we are successful however i get worried that people may have got bored after a while, which is why the average watching duration is 1:01.
This statistic shows me that the ratio from female to male that have watched this music video is very close to almost exactly equal. This shocked our group because we thought the views for our video would me dominated by females, as it symbolises girl power and empowered women, so we did not ever thing the reading would show the two genders being equal.
The music video's shown target market is 18-24 years as that is the majority of people who have viewed according to the YouTube statistics.


No comments:
Post a Comment